How creating a water poverty map for all of Africa can help sound policies

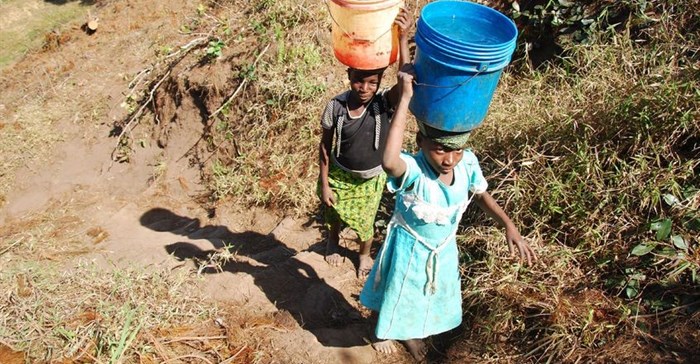
This lack of access can be fatal, particularly for children. The absence of clean water and basic sanitation is among the leading causes of mortality among those younger than five all across the continent. It also places a huge burden on Africa’s women. It is they who must walk long distances to gather water from streams, ponds and wells.
Research has also showed how unreliable water supply is simultaneously a cause and result of poverty. South African water researcher Dr Anthony Turton coined the phrase “water poverty” to describe societies that cannot cope with the problem of water scarcity.
This prompted the development of the Water Poverty Index by ecological and environmental economist Professor Caroline Sullivan in 2002. The index allows researchers to produce an integrated assessment of water stress and scarcity, linking physical estimates of water availability with socioeconomic variables that reflect poverty.
There’s wide agreement that the index is useful and reliable. But its indicators are not appropriate for all contexts. That’s why I set out to create a set of indicators that can be applied in the African context. These indicators include a country’s seasonal variability of rainfall; a nation’s water investments and how efficiently it uses water in agriculture and industry. Another indicator is a country’s Human Development Index, which takes into account factors like life expectancy, education and average income.
This allowed me to map Africa’s water poverty situation, giving a good sense of how different this is across countries on the continent.
My findings offer a transparent analysis for policymakers, governments and organisations that deal with water issues. They can use the information from the index to assess the opportunities and risks involved with interventions. They’ll also have a better understanding of the socioeconomic factors that affect different African countries’ water management policies rather than treating the whole continent as a homogeneous mass.
What will work in Seychelles, which has a low level of water poverty, will not necessarily be useful in Djibouti, whose water poverty levels are high.
New indicators for Africa
I chose 15 indicators from 22 variables to compute five components for the African Water Poverty Index: resources, access, capacity, use and
environment.
The results are mapped across a number of water poverty maps that I developed. They show that water poverty follows a complex, diverse spatial pattern. Africa’s most economically developed countries are also its most water-scarce. These are located mainly in northern and southern Africa and includes Libya, Algeria, Tunisia and South Africa. Water-rich but lower income countries are mainly concentrated in the sub-Saharan region – places like Gabon, Central African Republic and Congo.
This suggests that as some countries grow and attract more people looking for work, their water resources will become more pressurised. These countries must put long term, sustainable water management plans in place so they don’t run short of water – a scenario that would greatly hamper further economic development and growth.
The index also suggests what form these plans might take. North African countries, for instance, ought to pay more attention to improving the use of scarce water resources in agriculture and other sectors. Higher water efficiency and consumer conservation programmes are required.
In the sub-Saharan region, meanwhile, access to piped water and sanitation facilities remains generally very low. These countries may be “richer” in water than their northern counterparts, but this reality is not experienced by many residents. Anyone working in the water sector in these countries ought to be focusing on how to improve access to safe water and effective sanitation.
A useful tool
![]() My hope in creating this Africa-focused index is that policymakers, politicians and development experts will be able to apply the data. Such a multi-dimensional assessment of water poverty for the continent could make a big difference to management and planning.
My hope in creating this Africa-focused index is that policymakers, politicians and development experts will be able to apply the data. Such a multi-dimensional assessment of water poverty for the continent could make a big difference to management and planning.
Source: I-Net Bridge

For more than two decades, I-Net Bridge has been one of South Africa’s preferred electronic providers of innovative solutions, data of the highest calibre, reliable platforms and excellent supporting systems. Our products include workstations, web applications and data feeds packaged with in-depth news and powerful analytical tools empowering clients to make meaningful decisions.
We pride ourselves on our wide variety of in-house skills, encompassing multiple platforms and applications. These skills enable us to not only function as a first class facility, but also design, implement and support all our client needs at a level that confirms I-Net Bridge a leader in its field.
Go to: http://www.inet.co.za


